
workflows · 05
The day-trading windows: the tape, the movers, and the one-minute chart
Picture the last half hour of a big session — say the Friday Nvidia traded 195 million shares into a 4.4% down close. On a broker app that afternoon is one number changing. On the tape it's a story with characters: prints speeding up, size showing at a level, the 6:59:59 seller and whoever met them. Trade-by-trade, stamped to the second, is what markets look like under the summary — and it's the first of three windows that make the terminal worth an intraday trader's screen space.
First, the frame, so nobody wastes their time: Godel is not a trading platform. No orders route from it, and your broker keeps the execution job. The terminal's job is the information layer, and here's that layer.
The tape: NVDA EQ TAS
Time and sales is the raw record. The Size filter is the control that makes it readable — hide the noise trades and you're watching actual participants. The date-range inputs replay any session; the download button takes the prints out with you. Reading the tape is a craft (size clustering at a price, prints accelerating before a move), but the craft starts with having a tape at all, which no broker app gives you. TAS is a paid-seat window; the free tier shows you the fence.
The movers: MOST
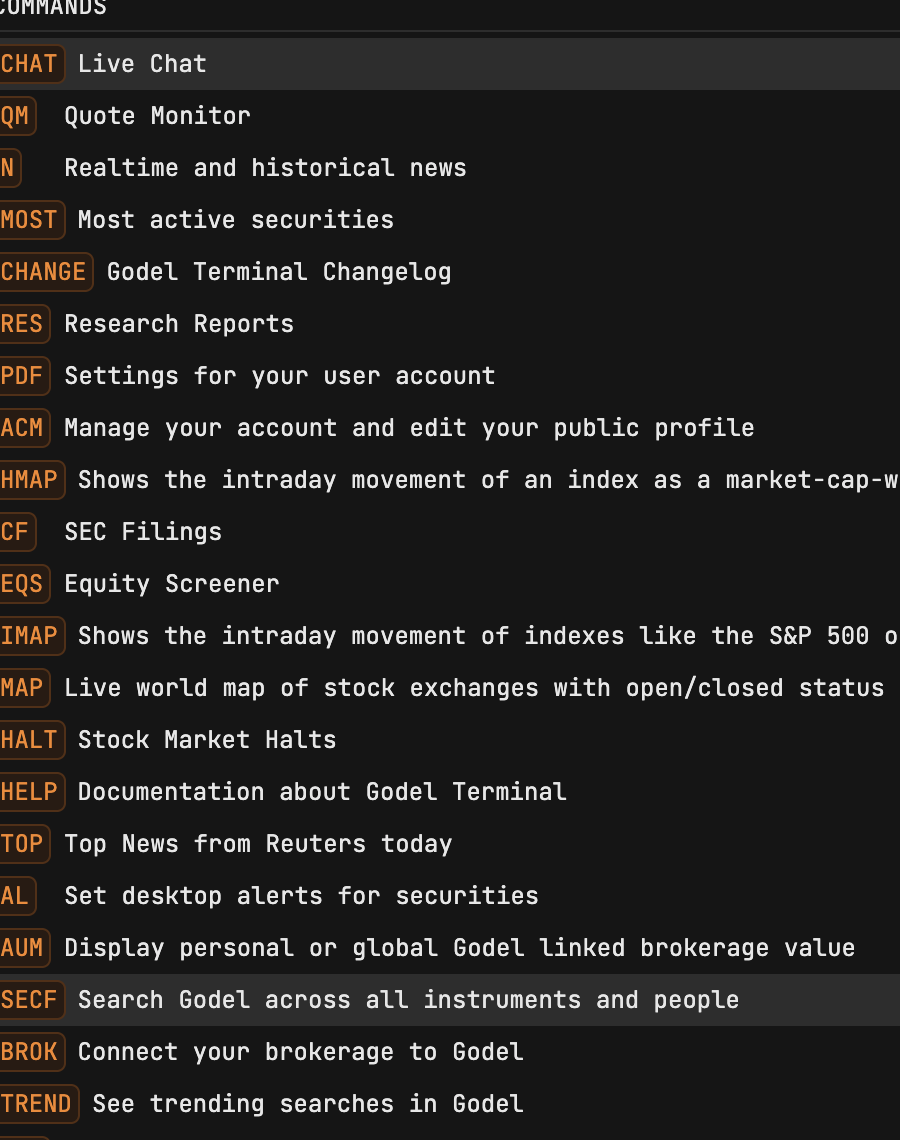
MOST is "what's moving, right now" as one window — active, gainers, losers, value, with min/max market-cap filters to cut the lottery tickets. Rows right-click into DES or the chart, which chains it straight into the triage loop when something on it demands the three minutes. One quirk to know in advance: it's a live-session screen, and outside market hours it's simply empty — the blank-windows page collects the screens that behave that way.
The fast chart: NVDA EQ G 1m
The chart command takes a resolution argument, so one-minute candles are one command, not a menu trip. The intraday pattern that earns its keep: the 1m chart color-linked to a watchlist, so every row click repaints the last hour of that name's life while the wire beside it explains the why.
The division of labor
Assemble it and the morning looks like this: the wall shows what's moving, MOST catches what your lists don't hold, the tape shows who's serious at the level, the 1m chart gives the move its shape, and alerts cover whatever you're not staring at. The terminal reads; your broker acts. Each tool doing the one job it's good at is the entire design — and the reason the reading side belongs on a machine built for it.
Tickers on this page are teaching examples, not recommendations. TickerFluent publishes education, not investment advice.