
start here · 02
Zero to terminal operator in 30 minutes
Godel Terminal opens on a nearly black screen with no menus anywhere, and if you've spent your life in normal software, your first instinct will be to move the mouse around looking for them. Save yourself the search. There are no menus because the whole product runs from the keyboard — every window on it comes from typing a short command, the way it works on the trading-floor terminals this thing is descended from.
This guide is your first half hour: the one key that runs everything, the
three-word command pattern, my one-minute reading order for a company page,
and the desk layout worth keeping. One housekeeping note before we start — I
practice on big liquid names like AAPL and NVDA in these guides because
every feature fires on them with no data gaps. That's a liquidity choice, not
a stock opinion. And everything on this page runs on the free tier, so you can
follow along without paying anyone anything.
The key under Esc
The key is backtick — ` — top-left of the keyboard. Press it
anywhere in Godel and the command line takes focus. That's the move you'll
make a hundred times an hour once this becomes your research tool: the
keyboard opens things, and the mouse just arranges them.
Try it now. Press ` and type AAPL — just the ticker — and stop. Don't
hit Enter yet. Look at what came back:
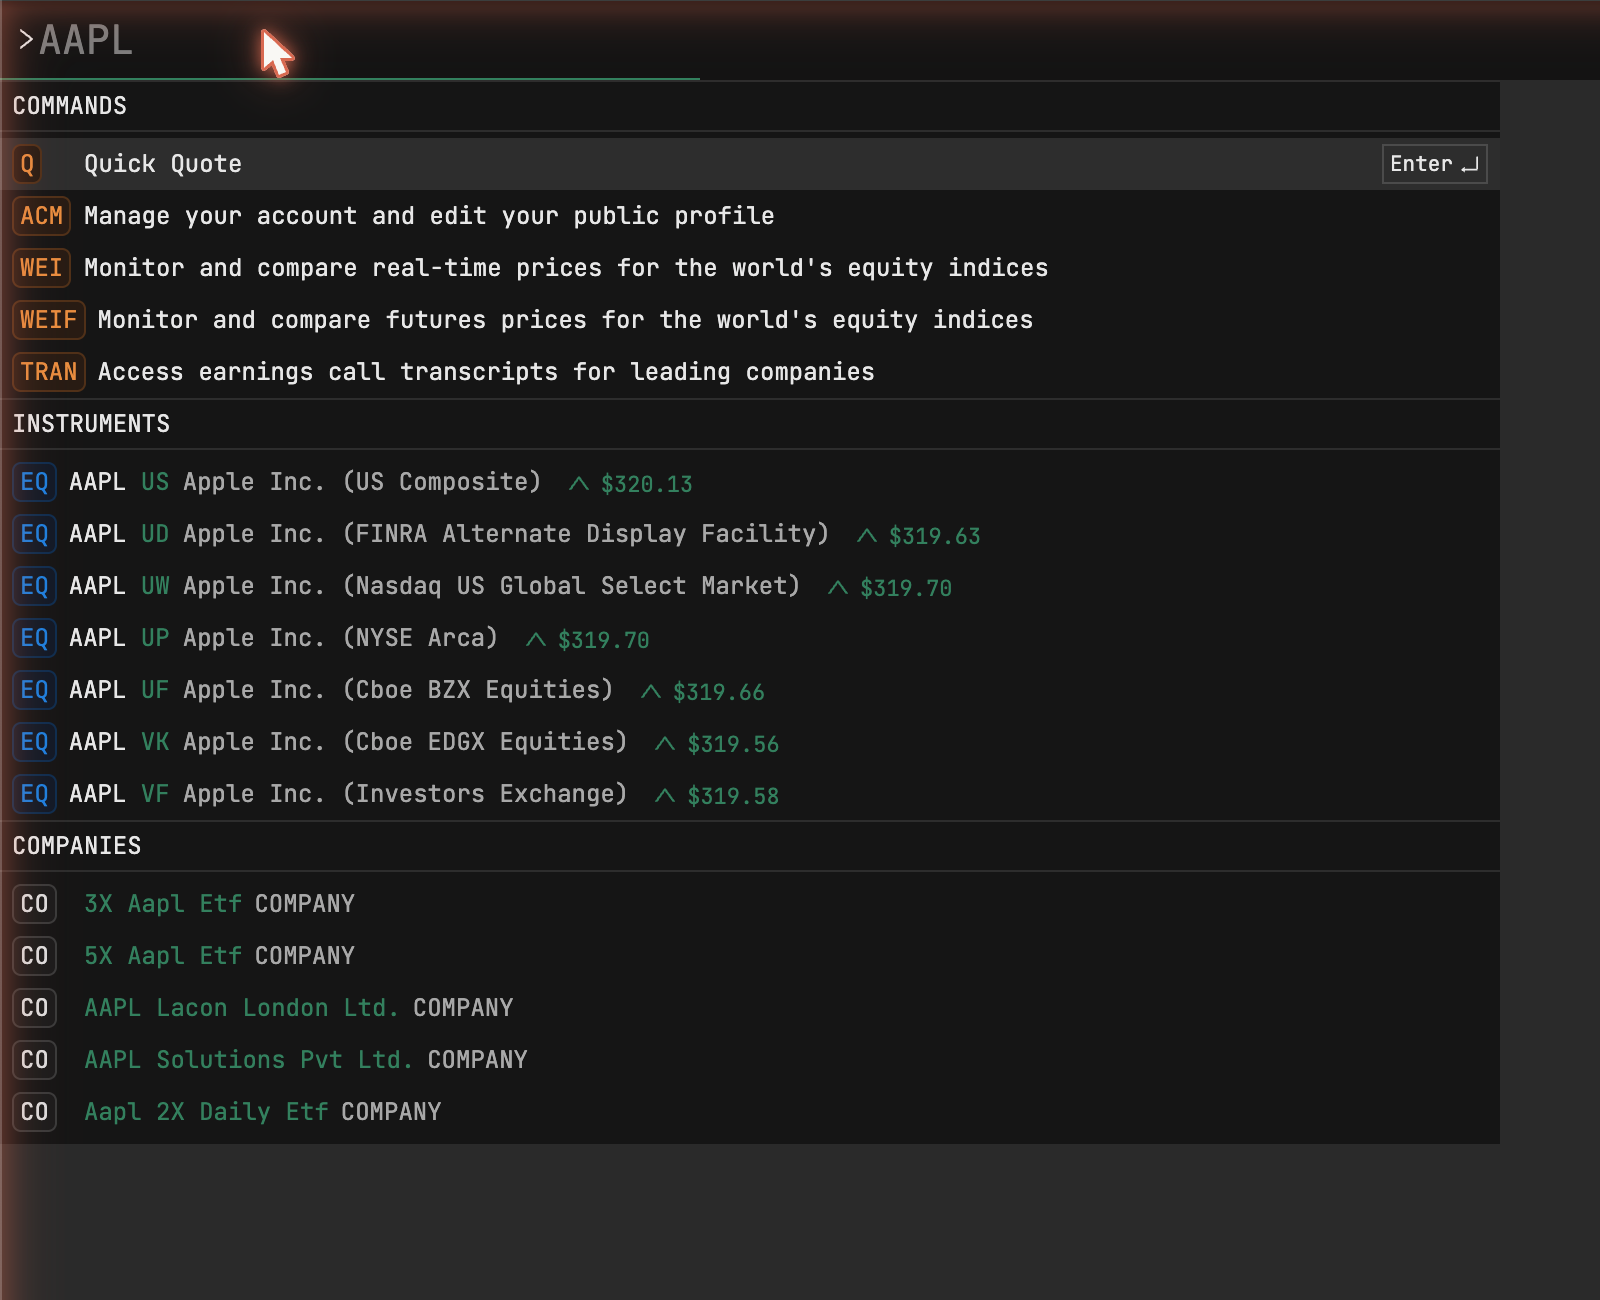
The dropdown is showing you three different kinds of thing, and it's worth a minute to understand them, because this palette is how you'll navigate everything from now on.
Commands sit on top — things you can run. One catch to learn early: the highlighted row is what Enter executes, not the text you typed. I've run Quick Quote instead of the chart this way more than once, so glance at the highlight before you commit.
Instruments in the middle is the same Apple stock listed seven different
ways, which looks like a bug and isn't. US is the composite — the blended
view you almost always want. The others (UP for NYSE Arca, UF for Cboe,
UW for Nasdaq…) are the individual venues where Apple trades.
Broker apps hide this plumbing; a terminal shows it because professionals
sometimes need a specific venue. You don't yet. US is the one to type.
Companies at the bottom are corporate records, including companies with no stock at all. File that away — the screener guide does something interesting with it.
Press Esc to close the palette.
One sentence, one company, everything
Now the first real command. Press `, type AAPL EQ DES, glance that
DES is the highlighted row, and hit Enter.
What you typed is the pattern every command on this site follows —
TICKER ASSET-CLASS COMMAND — and what you get back is this:
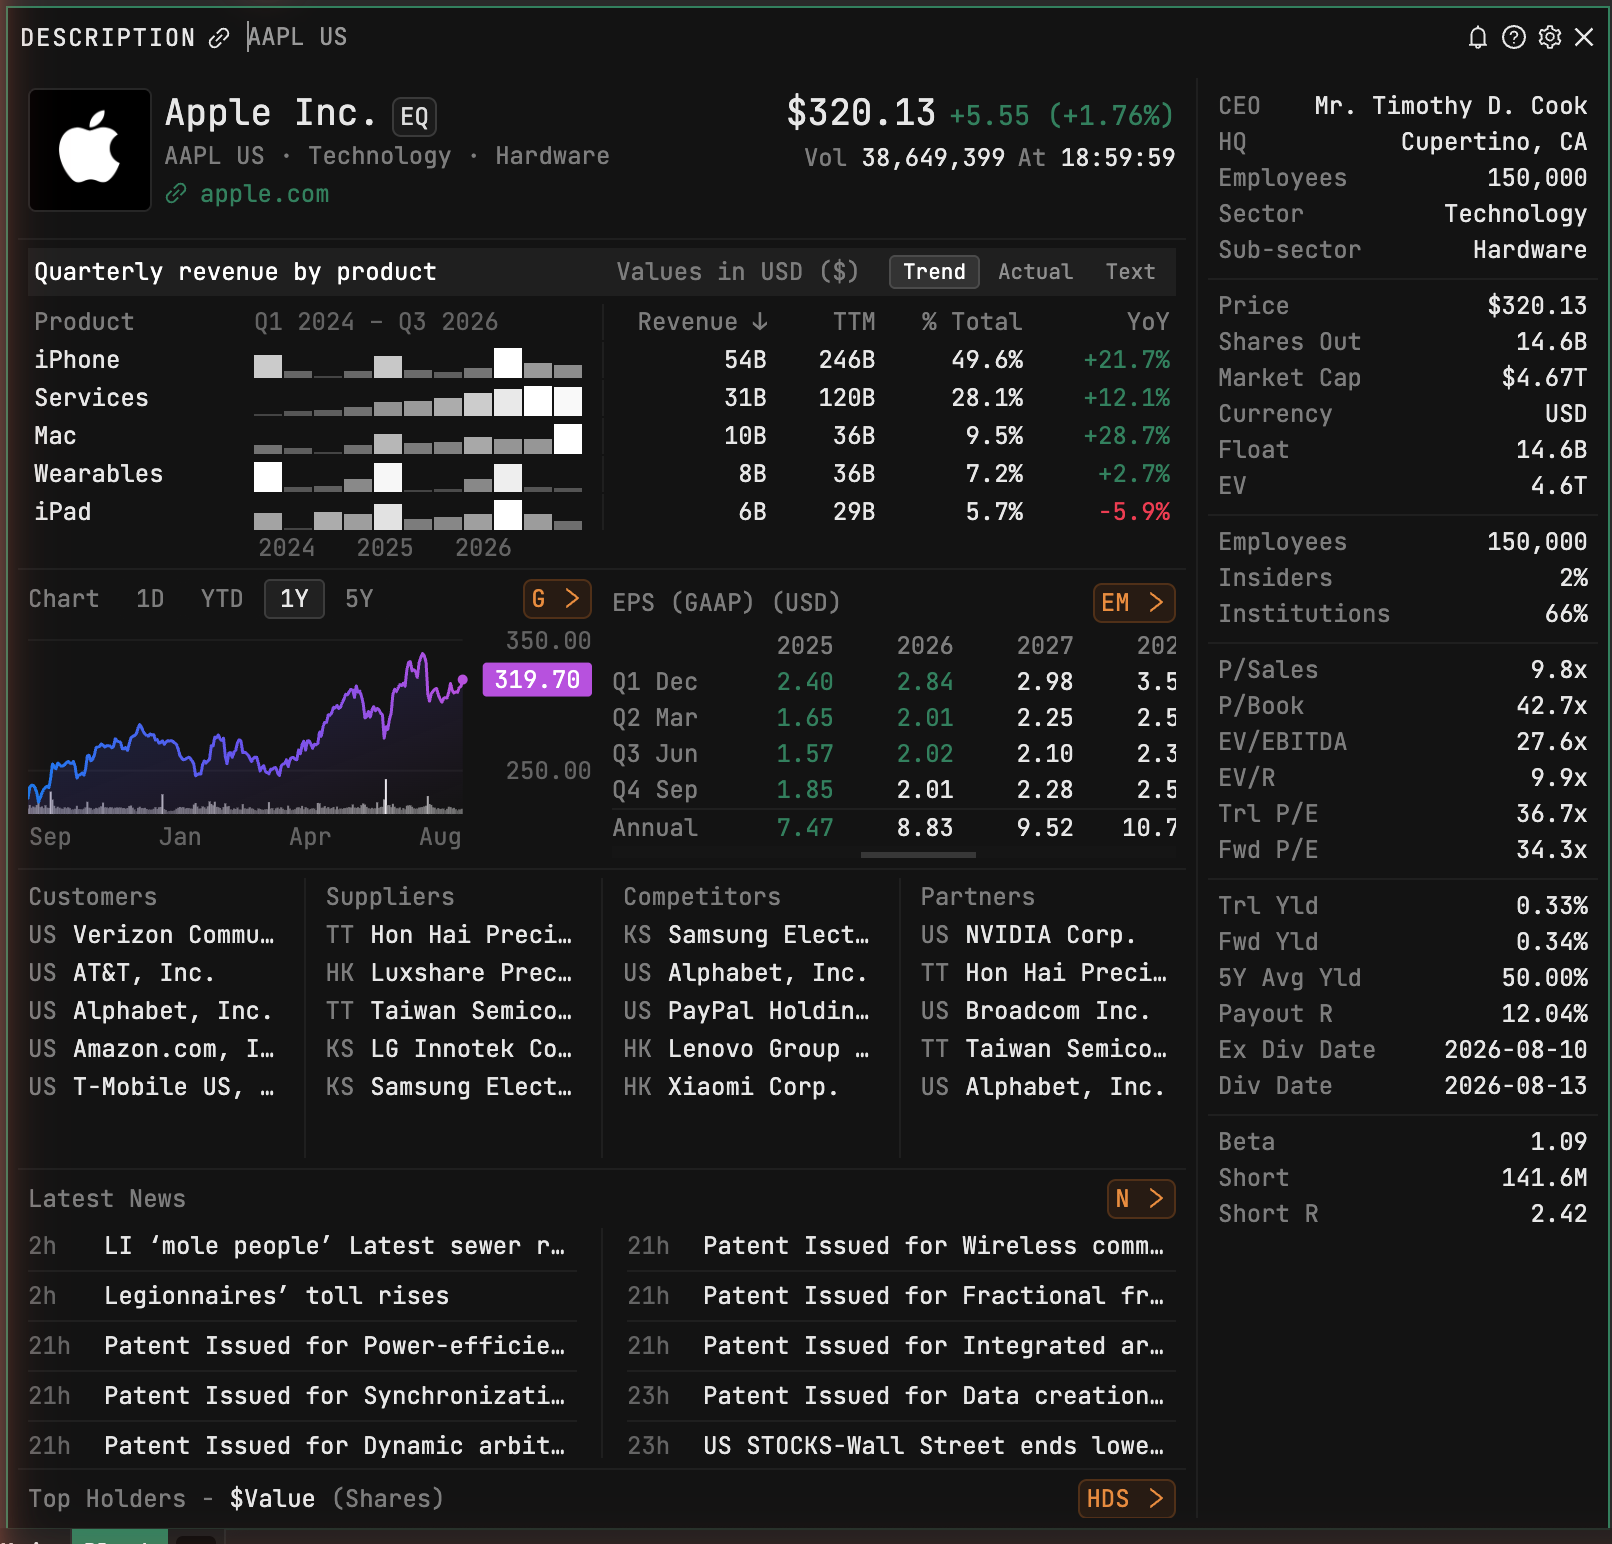
It's dense on purpose, and the trick is having a reading order instead of trying to absorb it all at once. Mine takes about a minute.
I start at the price block — not for the price, but for the timestamp on the last trade, and for whether there's a (D) delayed badge next to it. On a US stock there shouldn't be one. The habit pays off later on international names, where the data runs fifteen minutes behind and the badge is the only warning you get.
From there I go straight to quarterly revenue by product, the table I use most on any company. The day I captured that screenshot, iPhone was 49.6% of Apple's trailing revenue and Services was 28.1% — one glance and you know what moves this company. On anything unfamiliar I read this table before the business description, because the description is written by the company and the segment table is filed to accounting standards.
The right-hand column is the how-is-it-priced strip: market cap, float, valuation ratios, short interest, dividend dates. Below that, an EPS matrix shows actual prints against forward estimates, so you get beat-and-miss context without opening another window. And the bottom half is the part retail tools mostly don't have at all — customers, suppliers, competitors, partners, the supply chain mapped out, plus the biggest 13F holders.
One more thing before you move on. See the little orange chips scattered
around the page — G >, EM >, HDS >? DES is a hub, and every section of
it links to the full window behind it. Half my navigation is chips on a DES
page.
Charts and news speak the same sentence
Same grammar, new last word. Press `, type NVDA EQ G, check the
highlight says G — Historical and realtime charting, Enter:
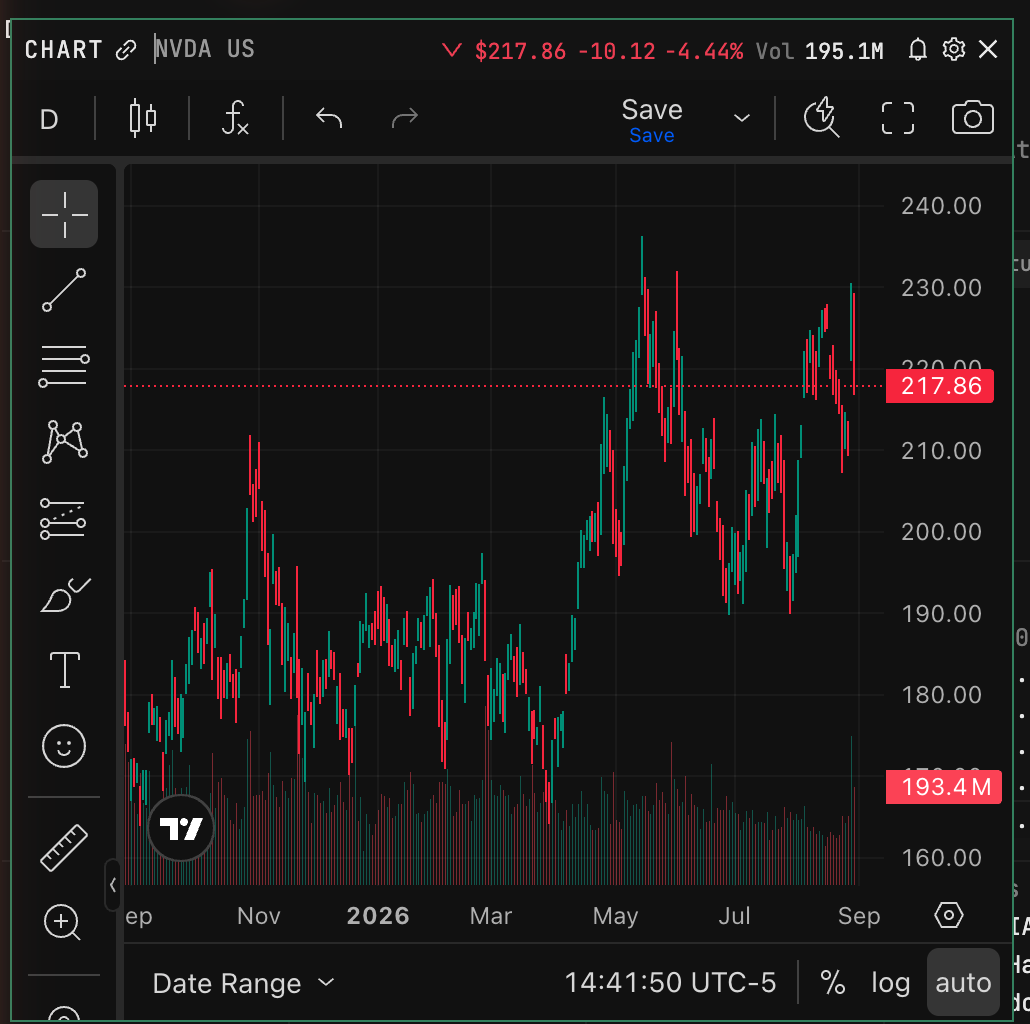
If you've used TradingView anywhere, you already know this chart — it's a
licensed TradingView engine, so the drawing tools and indicators you know are
all here. The resolution control sits top-left, or you can open at a
resolution directly: NVDA EQ G 1m gets you one-minute candles.
News is AAPL EQ N. The wire is a firehose by design — every source, all
day — and three habits make it readable from the first minute: / searches
inside the stream, Pause freezes it while you read, and the source
filters are where you eventually shape it into your own feed.
And then there's the part of the news system nobody warned me about. While I was capturing screenshots for this guide, on a Saturday afternoon with the market closed, the bottom of my screen did this:

2:40:06 PM — IRAN DEPUTY FOREIGN MINISTER SAYS NOT IN A HURRY TO REOPEN STRAIT OF HORMUZ. Stamped to the second, on a weekend, while every other app I own was quiet. That timestamp is the point of the whole machine: you always know exactly how old a number or a headline is, and once you're used to that, feeds without timestamps start to feel off.
Build the desk
Windows float free, which feels chaotic for about five minutes, until you learn the four moves: drag by the title bar, Shift+arrows to nudge, Ctrl+Shift+arrows to snap to an edge, Option+arrows to resize. Tab cycles between windows, Esc Esc closes the focused one, and Cmd+Z un-closes it — which you will need, because I still fat-finger Esc Esc into the wrong window about once a day.
Now build this screen:
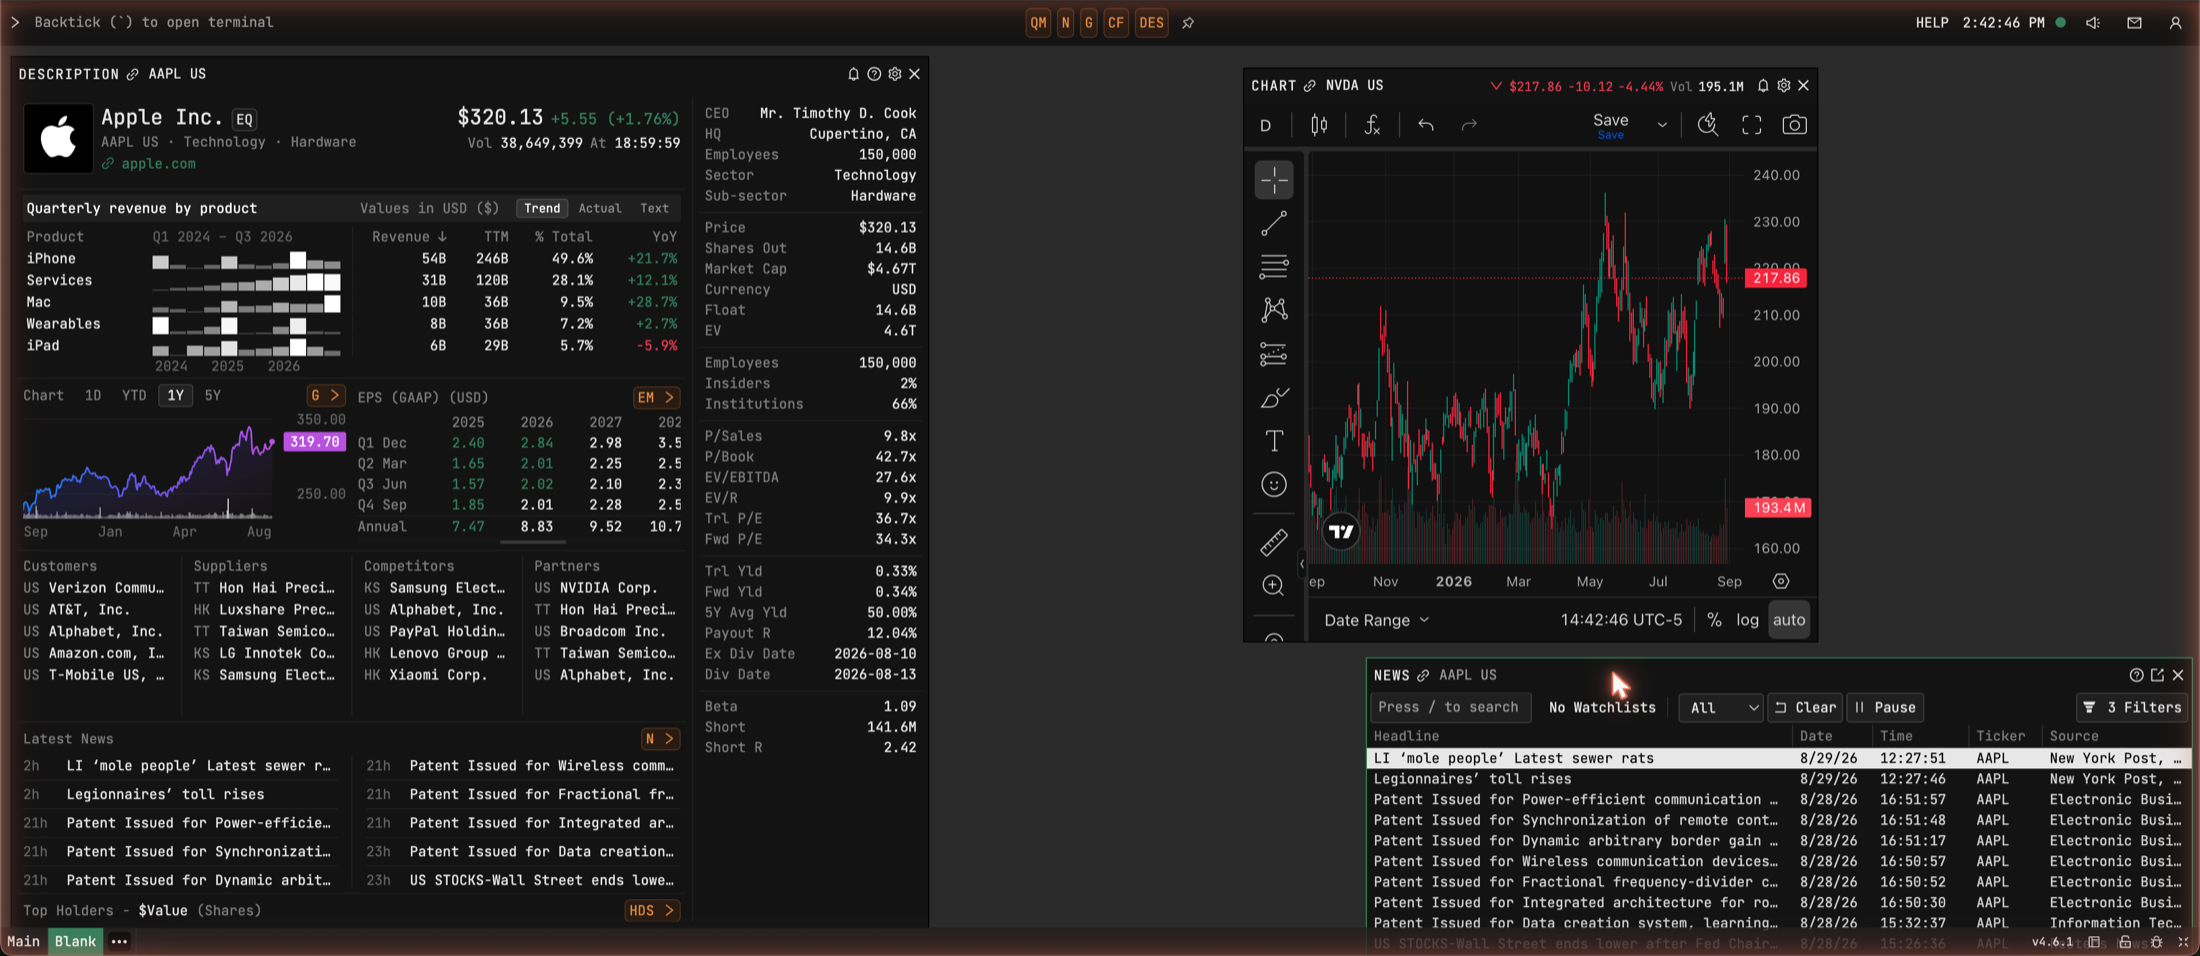
DES on the left, chart top-right, news under it. That's the arrangement I still use every day. The tabs at bottom-left ("Main", "Blank") are separate workspaces, so you can keep a research screen on one and a monitoring screen on another. Layouts save to your account on their own — close the browser tonight and it's all there tomorrow.
Run it once before you leave
No hand-holding this time: ` → a ticker you follow → EQ DES → read the
segment table → chip into G > → Esc Esc until clean. It takes under a
minute, and after a few repetitions it stops feeling like commands at all.
Five more worth trying while you're warm: QM for watchlists
(guide 04 builds the full monitoring
screen), EQS for the 60,000-listing screener
(the reference), TOP for Reuters' top fifteen, WEI for
world indices at a glance, and HELP — the built-in manual, which is decent,
and which you'll now mostly never need.
When it fights you
Every beginner hits the same five walls, so here they are in advance. Typing does nothing? The command line isn't focused — backtick first, always backtick. Enter ran the wrong thing? The palette executes the highlighted row, not your literal text; glance before you commit, and Tab moves the highlight. Chart came up empty? Almost always a thin listing without the right feed — prove the window works on a liquid US name, then blame the security. Seeing "Account required"? That's the free tier's fence, not a bug. And if your screen doesn't quite match my screenshots, that's the product shipping weekly — pixel-level details move, the commands have been stable, and every image here is dated so you can judge its age.
Next: story or fire in 3 minutes, the research loop all these keystrokes were for.
Tickers on this page are teaching examples, not recommendations. TickerFluent publishes education, not investment advice.