
workflows · 09
The screen free sites can't run: 60,000 listings, private companies included
The first time I sorted this screener by market cap, the top of the list looked the way you'd expect — Nvidia, then Apple, Microsoft, Amazon, the usual procession. Then, a couple dozen rows down, sitting between Broadcom and Eli Lilly like it belonged there: Anthropic. A private company, with a little "P" badge on its ticker and a valuation over a trillion dollars. OpenAI showed up a few rows later. Then SpaceX. Then ByteDance.
That's the thing to understand about EQS before we get to any buttons: the
universe is everything. Roughly 60,000 listings across every world venue —
the count read 60,152 the first day I checked and 60,153 two days later,
drifting as listings come and go — with the private giants sitting right in
the table for reference. A free screener covers a few thousand US names and
calls it a day. When you run a screen here, you're searching markets most
tools don't know exist.
A real screen, run on a Sunday
The market was closed the morning I ran the screen below, which is exactly the point — screening is weekend work, the homework that decides what Monday's watchlist holds. The question I gave it: mid-cap technology, somewhere between $500 million and $5 billion, trading under three times sales. Three filters in the left panel — market cap range, sector, P/S — plus two toggles that matter: Show primary listings only, so each company appears once instead of once per exchange, and Hide results with no trades, which drops the zombie rows. Then Run.
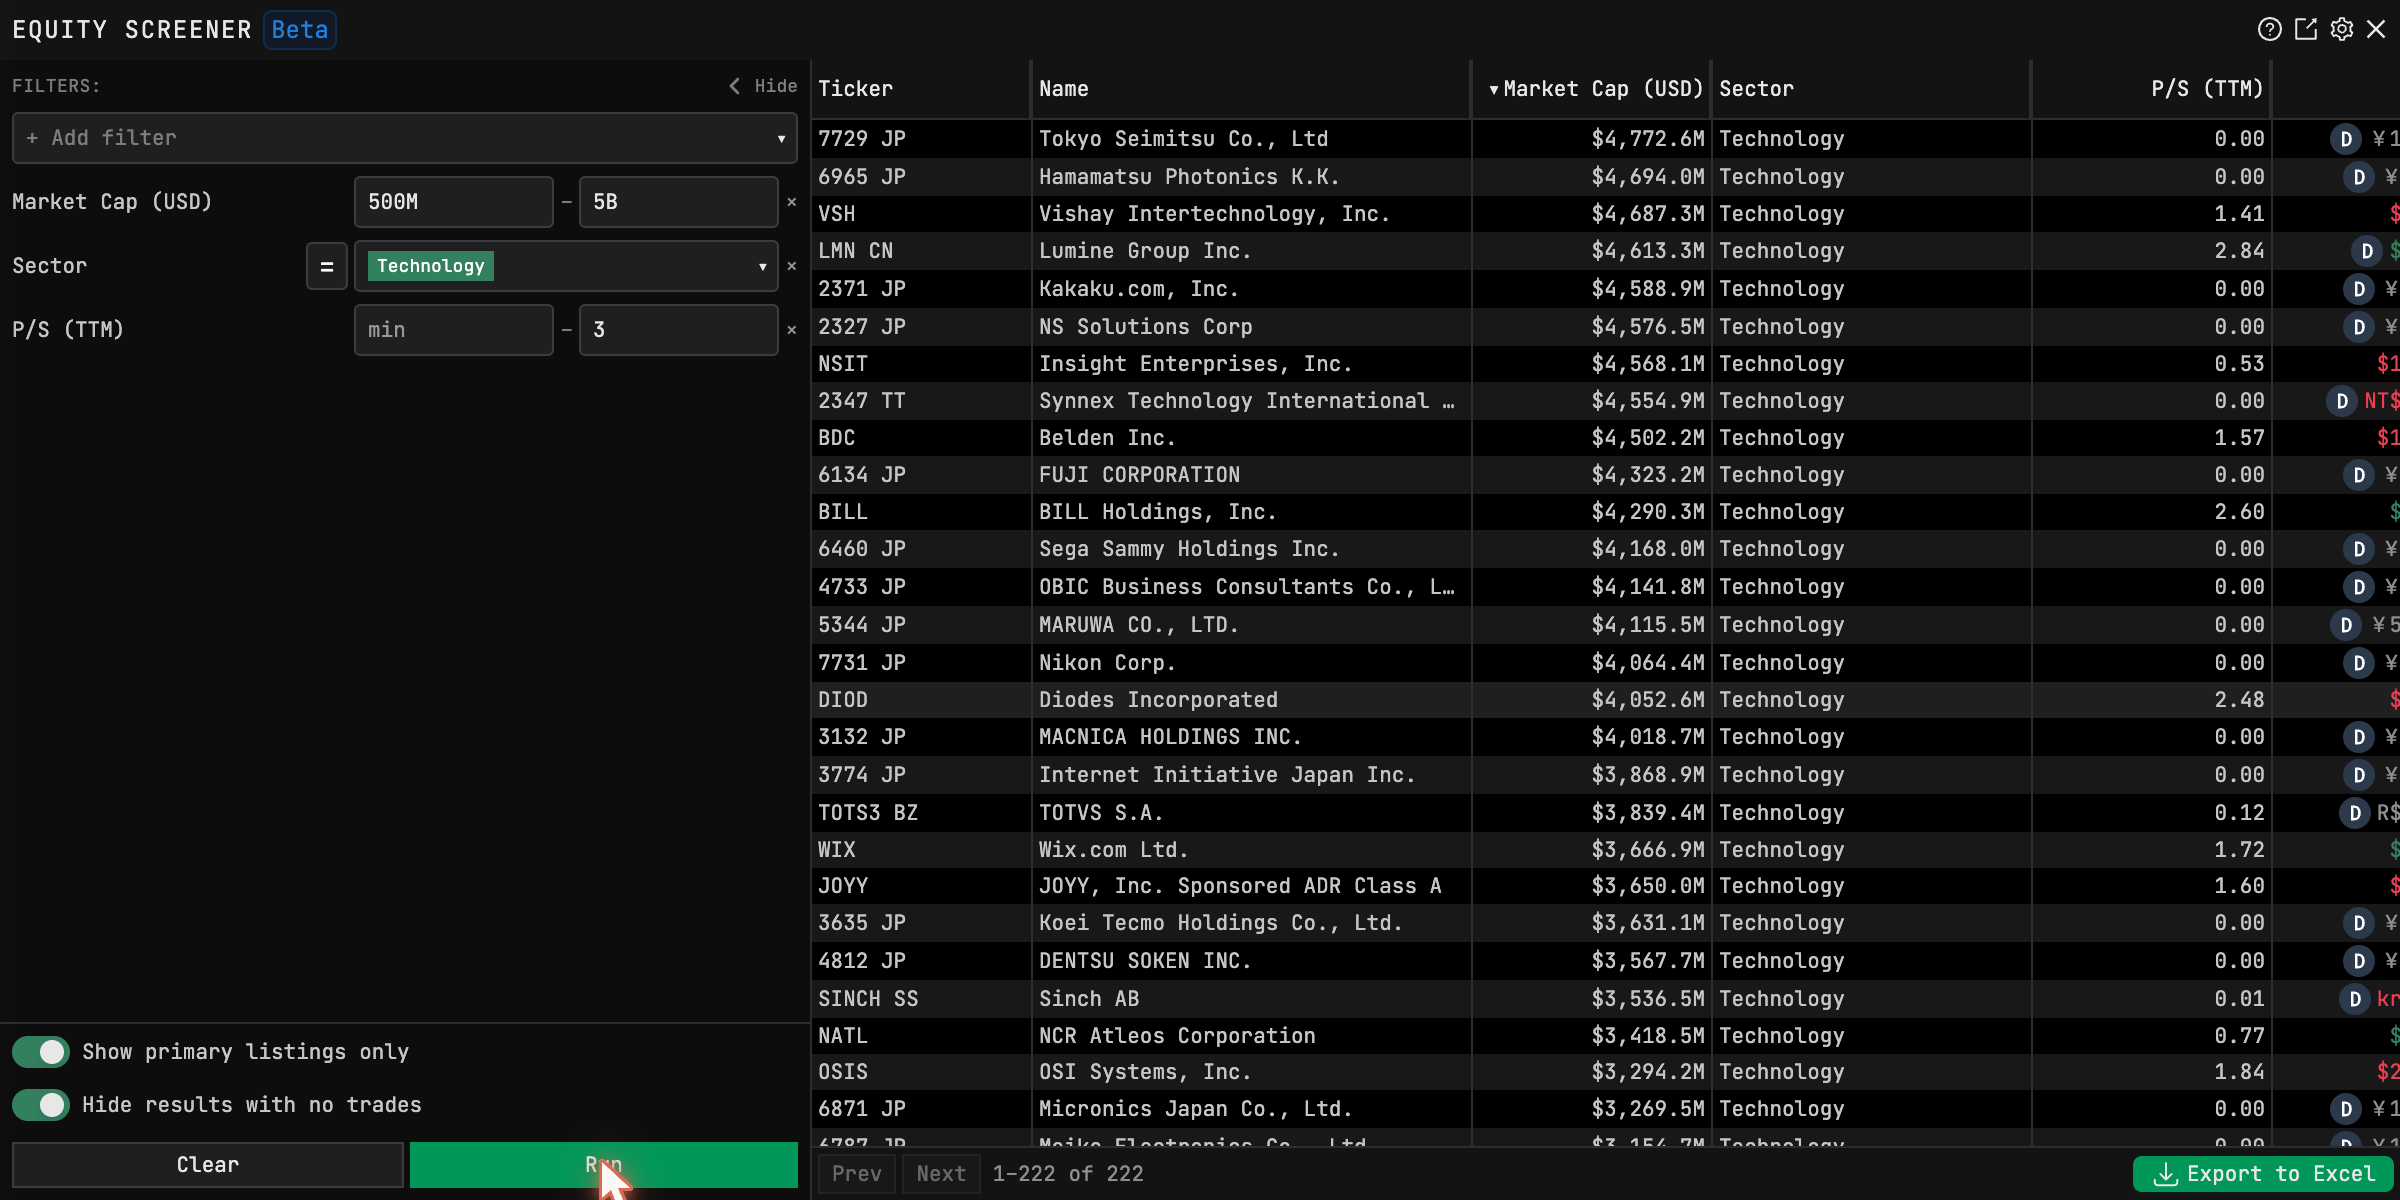
Two hundred twenty-two matches, and the first thing you notice scrolling them is how Japanese they are — Tokyo Seimitsu and Hamamatsu Photonics at the top by size, then Vishay, Lumine Group, Kakaku.com, Insight Enterprises, Belden, BILL, Sega Sammy, Nikon, Wix. A cheap-tech screen run over the whole world turned out to live mostly in Japan that weekend, which is an answer a US-only screener is structurally incapable of giving you. Whether any single row deserves attention is what the triage loop exists to decide — a right-click on any row opens DES and drops the name straight into it.
One honest warning from that same run, visible in the capture: a lot of international rows print a P/S of 0.00. That's not a bargain — it's missing data slipping through the "under 3" filter. Sort by the P/S column and read from the top of the real numbers, and treat any too-good ratio on a foreign listing as a data question before a valuation one.
Reading the results like an operator
A few things the window does that reward knowing. The filters accept
shorthand — 500M and 5B type exactly like that. International rows carry
their venue suffix and the (D) delayed badge, so
the two-clocks problem follows you into
screening: a delayed foreign print next to a live US one is not the same
kind of number. Private rows have the P badge and no live price — reference
data, not opportunities. The count at the bottom is honest about paging
(500 rows per page, so a big screen means walking pages), and there's an
Export to Excel button whose full-set behavior I haven't verified — test it
on a screen small enough to count before trusting it with a big one.
And the window carries a Beta tag it earns: controls have moved between my visits. The workflow above hasn't.
Where the screen fits
The sequence that makes this window pay is weekly, not daily. Sunday: run the screens, walk the survivors through the loop, and let the few that earn it join Monday's watchlist. The screener finds names before your feed does; the wall watches them; the loop sorts them when they move. That's the whole machine, and this window is where it starts.
Tickers on this page are teaching examples, not recommendations. TickerFluent publishes education, not investment advice.